Black Quantum / Pictures

The same problem, in pictures

Nothing here is a stock photograph. Each picture is a real record from a field where the measurements arrive on their own clocks, and each carries its source. Click any picture for the full-resolution file.

Astronomy

Four ticks of an observed clock
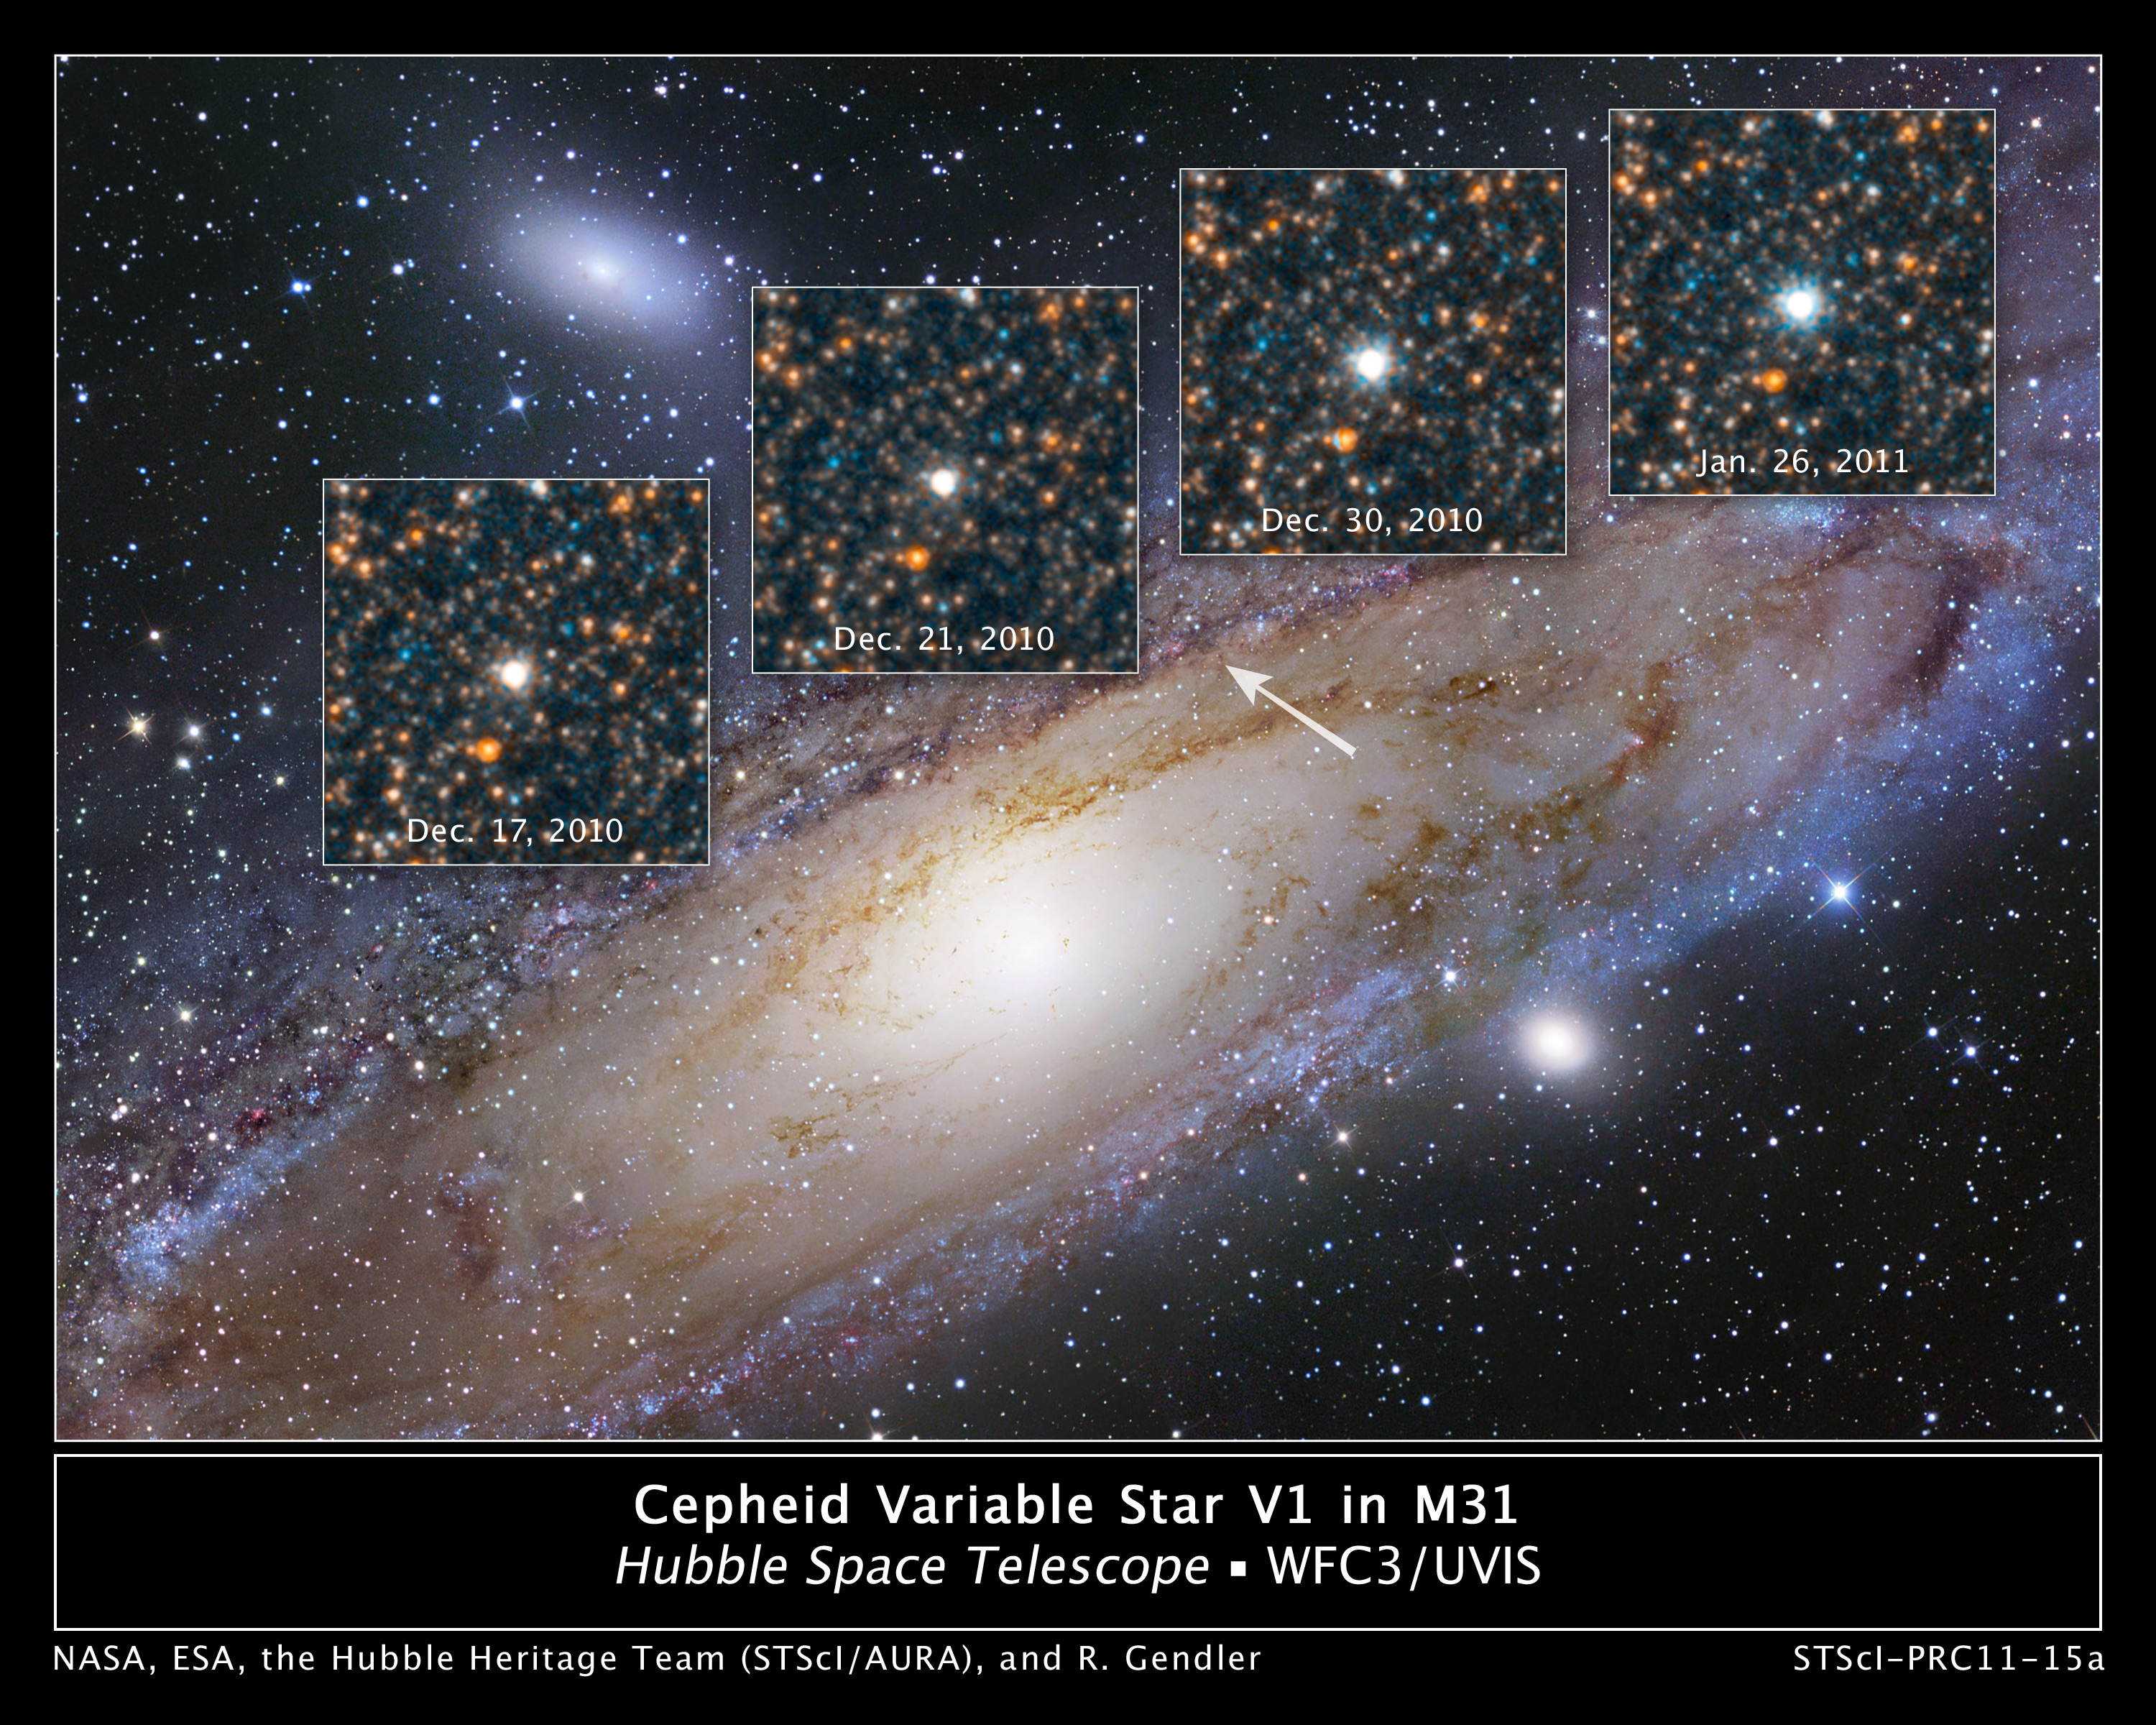
Hubble Space Telescope, 2010–11
The Andromeda galaxy with four Hubble close-ups of the Cepheid variable V1, dated Dec 17, Dec 21 and Dec 30, 2010 and Jan 26, 2011.
V1, the Cepheid in Andromeda that Edwin Hubble used in 1923 to show the nebula was a galaxy of its own. Four visits, Dec 17, Dec 21, Dec 30 and Jan 26, timed from an ephemeris that AAVSO amateurs built out of 214 ground observations, and the whole 31.4-day light curve is pinned down. Why this picture started the lab → Image: NASA, ESA, the Hubble Heritage Team (STScI/AURA), and R. Gendler. Hubble views the star that changed the universe, May 2011.
Astronomy

Thirty-six clocks, none of them shared

Hubble Space Telescope, 2003–21
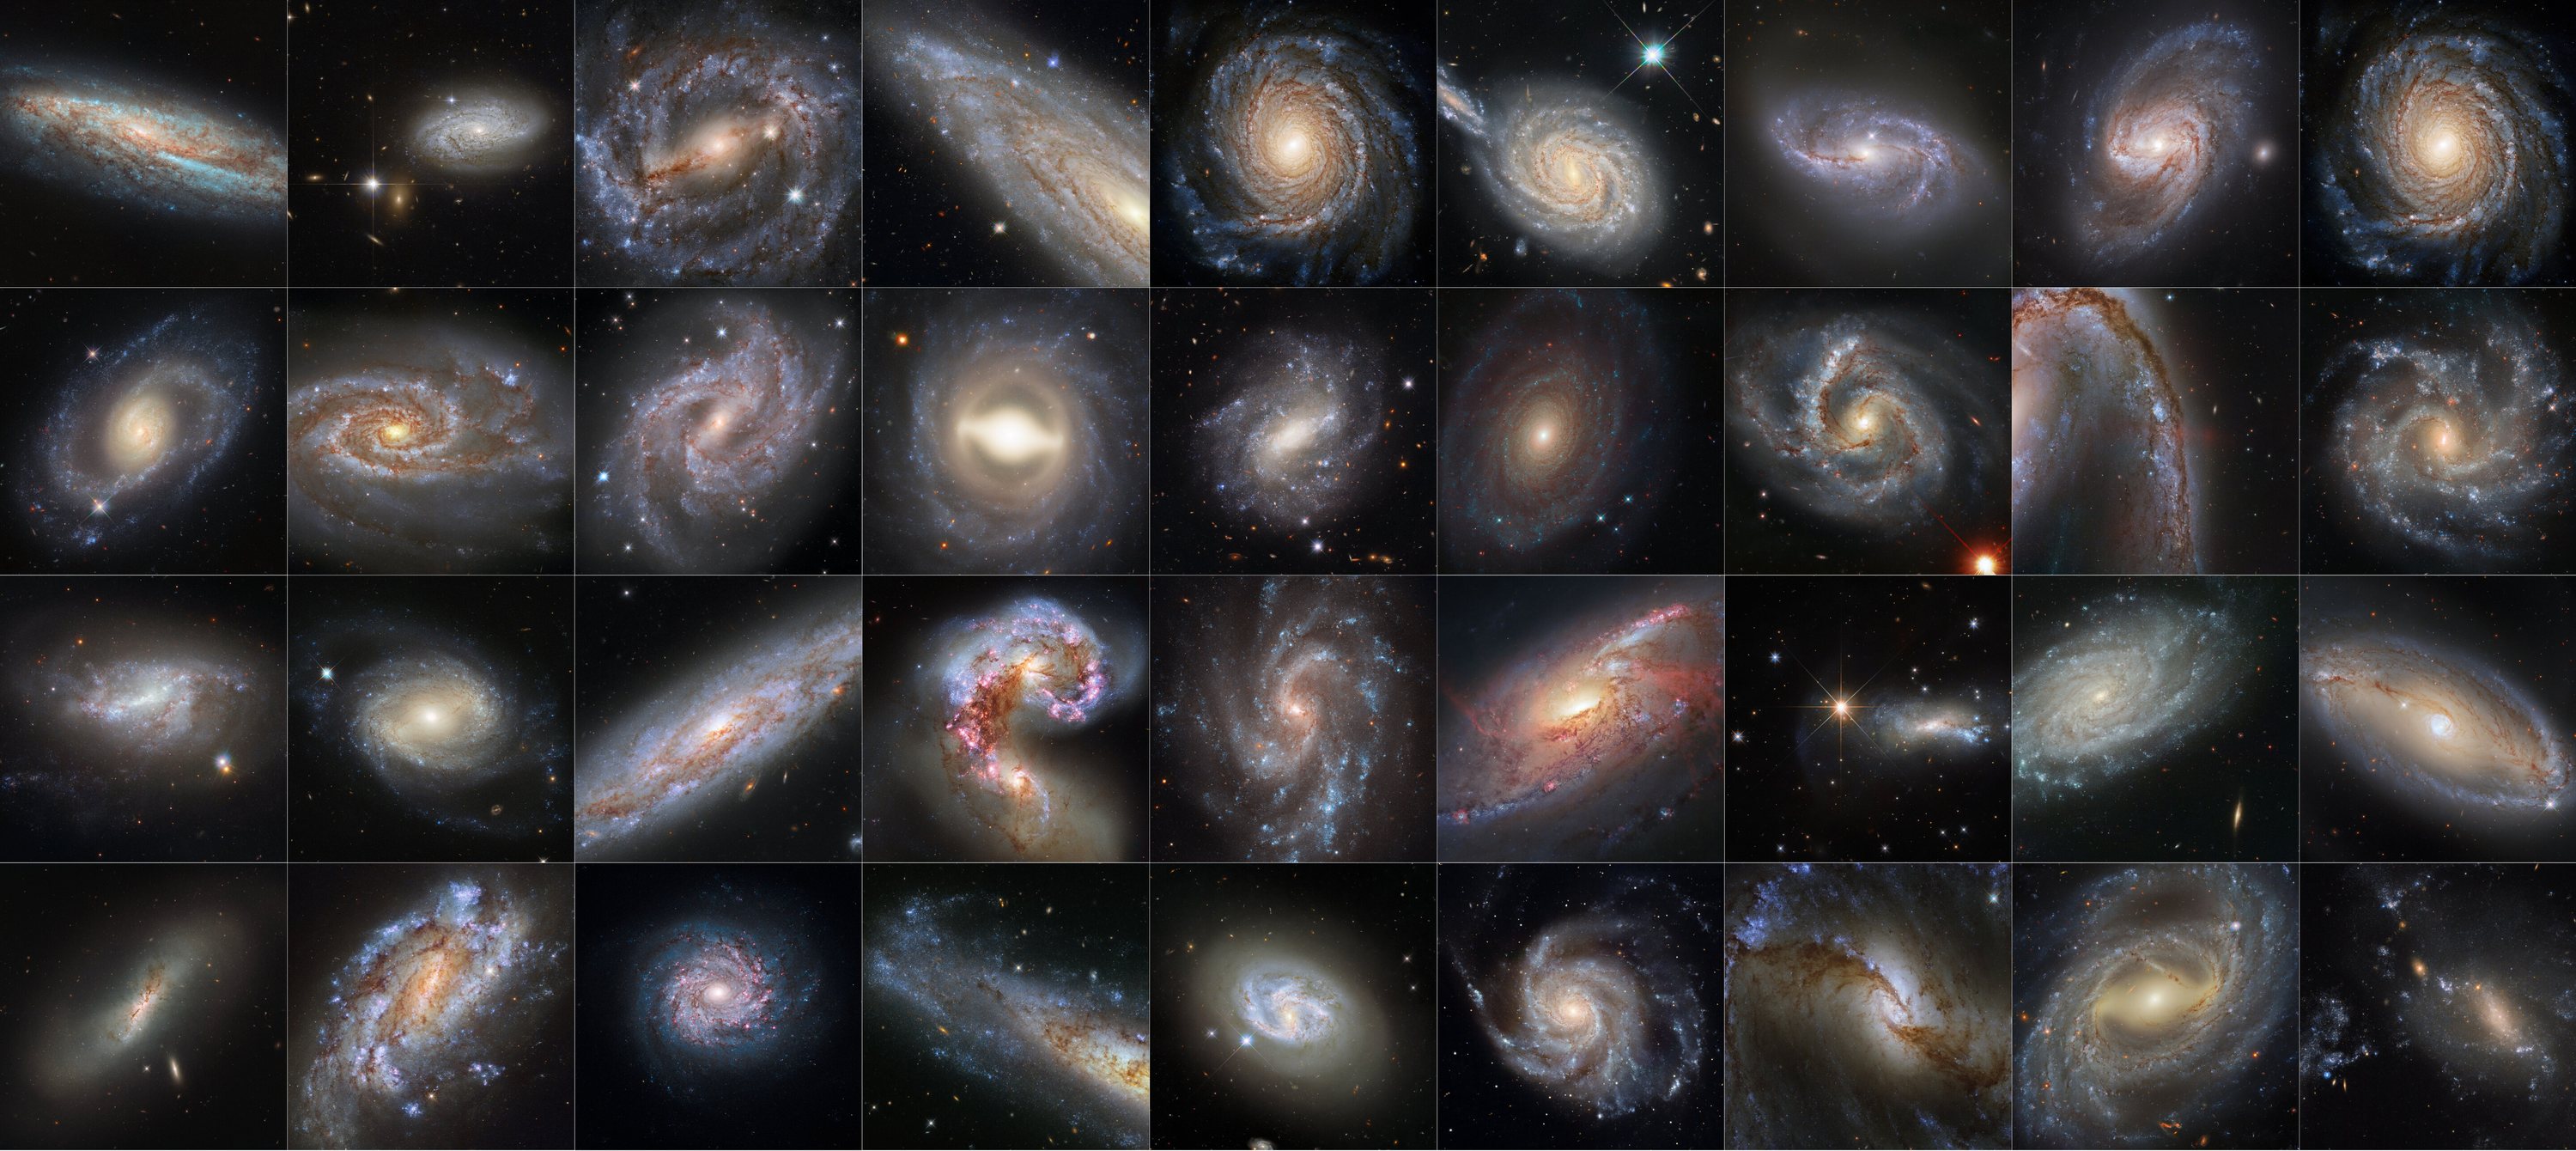
A grid of 36 Hubble images of spiral galaxies, each a host to both Cepheid variables and a Type Ia supernova.
Every galaxy here hosts both Cepheid variables and a Type Ia supernova. Imaged across six observing programmes, they are the rungs of the distance ladder behind the SH0ES measurement of the local expansion rate, and every rung rests on light curves sampled whenever the telescope could look. Image: NASA, ESA, Adam G. Riess (STScI, JHU). A dazzling Hubble collection of supernova host galaxies, May 2022.
Climate science

Thirty-eight years of snow, 1,837 metres down

GISP2 ice core, Greenland
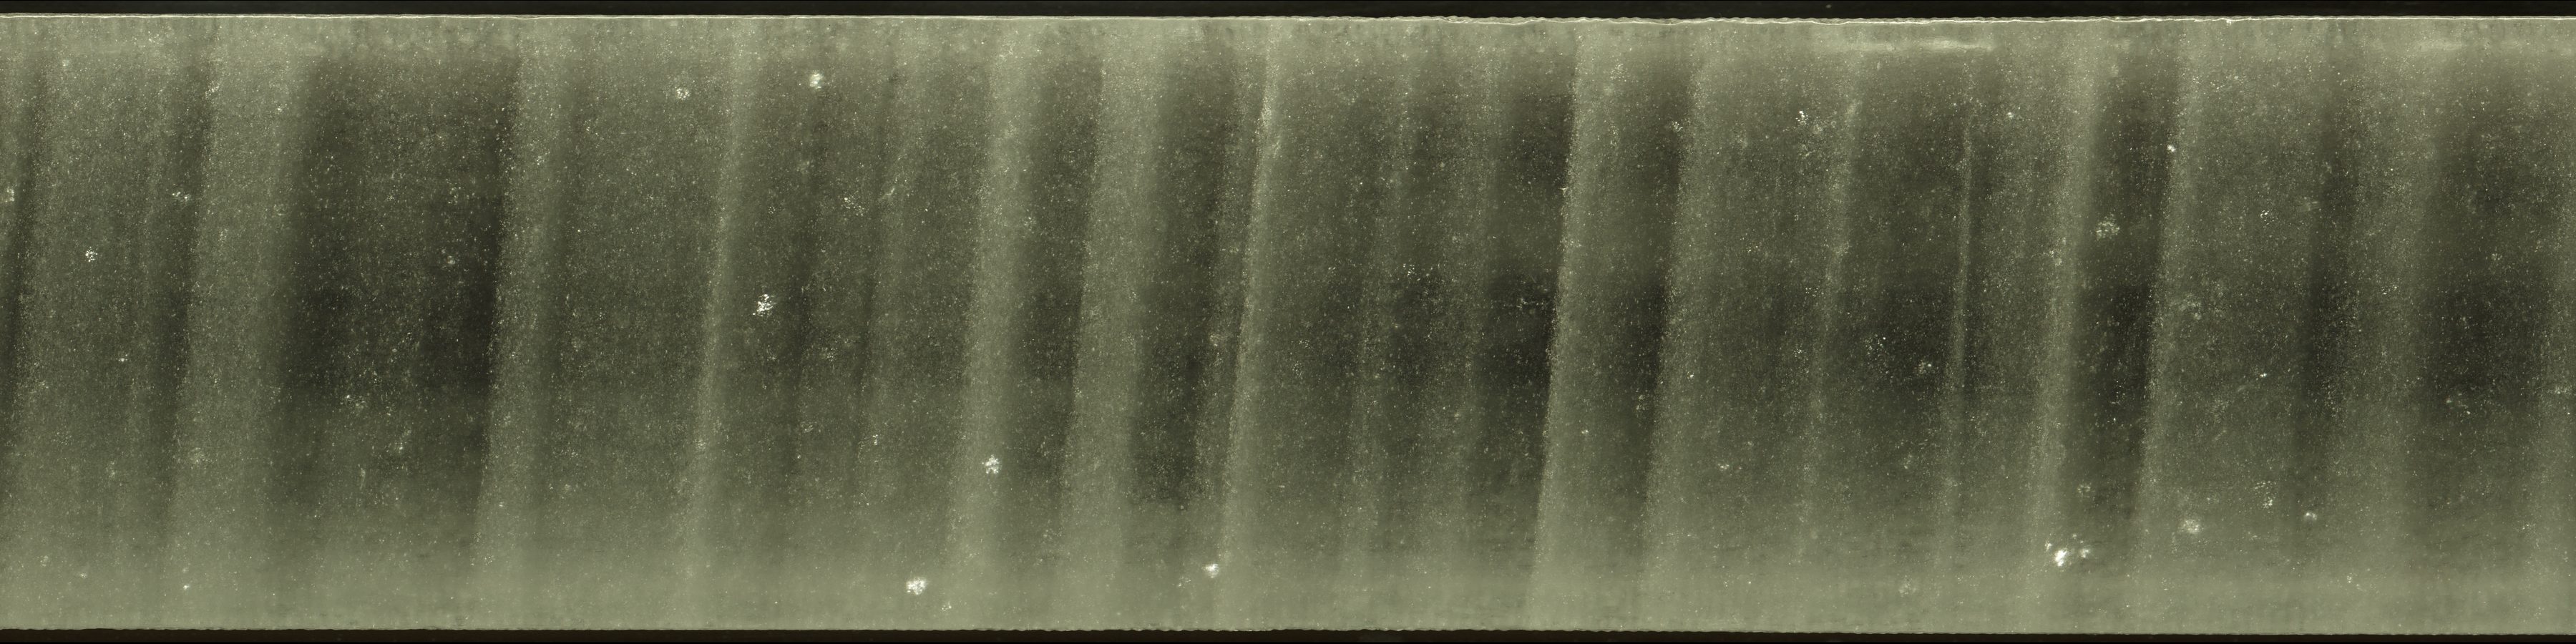
A section of the GISP2 Greenland ice core with dozens of pale and dark annual layers running across it.
A section of the GISP2 core from 1,837 to 1,838 metres, about 16,250 years old, with roughly 38 annual layers visible. The bands come from seasonal changes in crystal size and trapped air. Every layer is a year and no two are the same thickness. What the core gives you is depth; time has to be inferred, with its own error, and correlating two cores means aligning two clocks that were never shared. Image: National Ice Core Laboratory, US Geological Survey, with NSF funding; provided by Eric Cravens. Via Wikimedia Commons. Public domain.
Clinical medicine

The health record, the day it was born

Temperature chart, June 1871
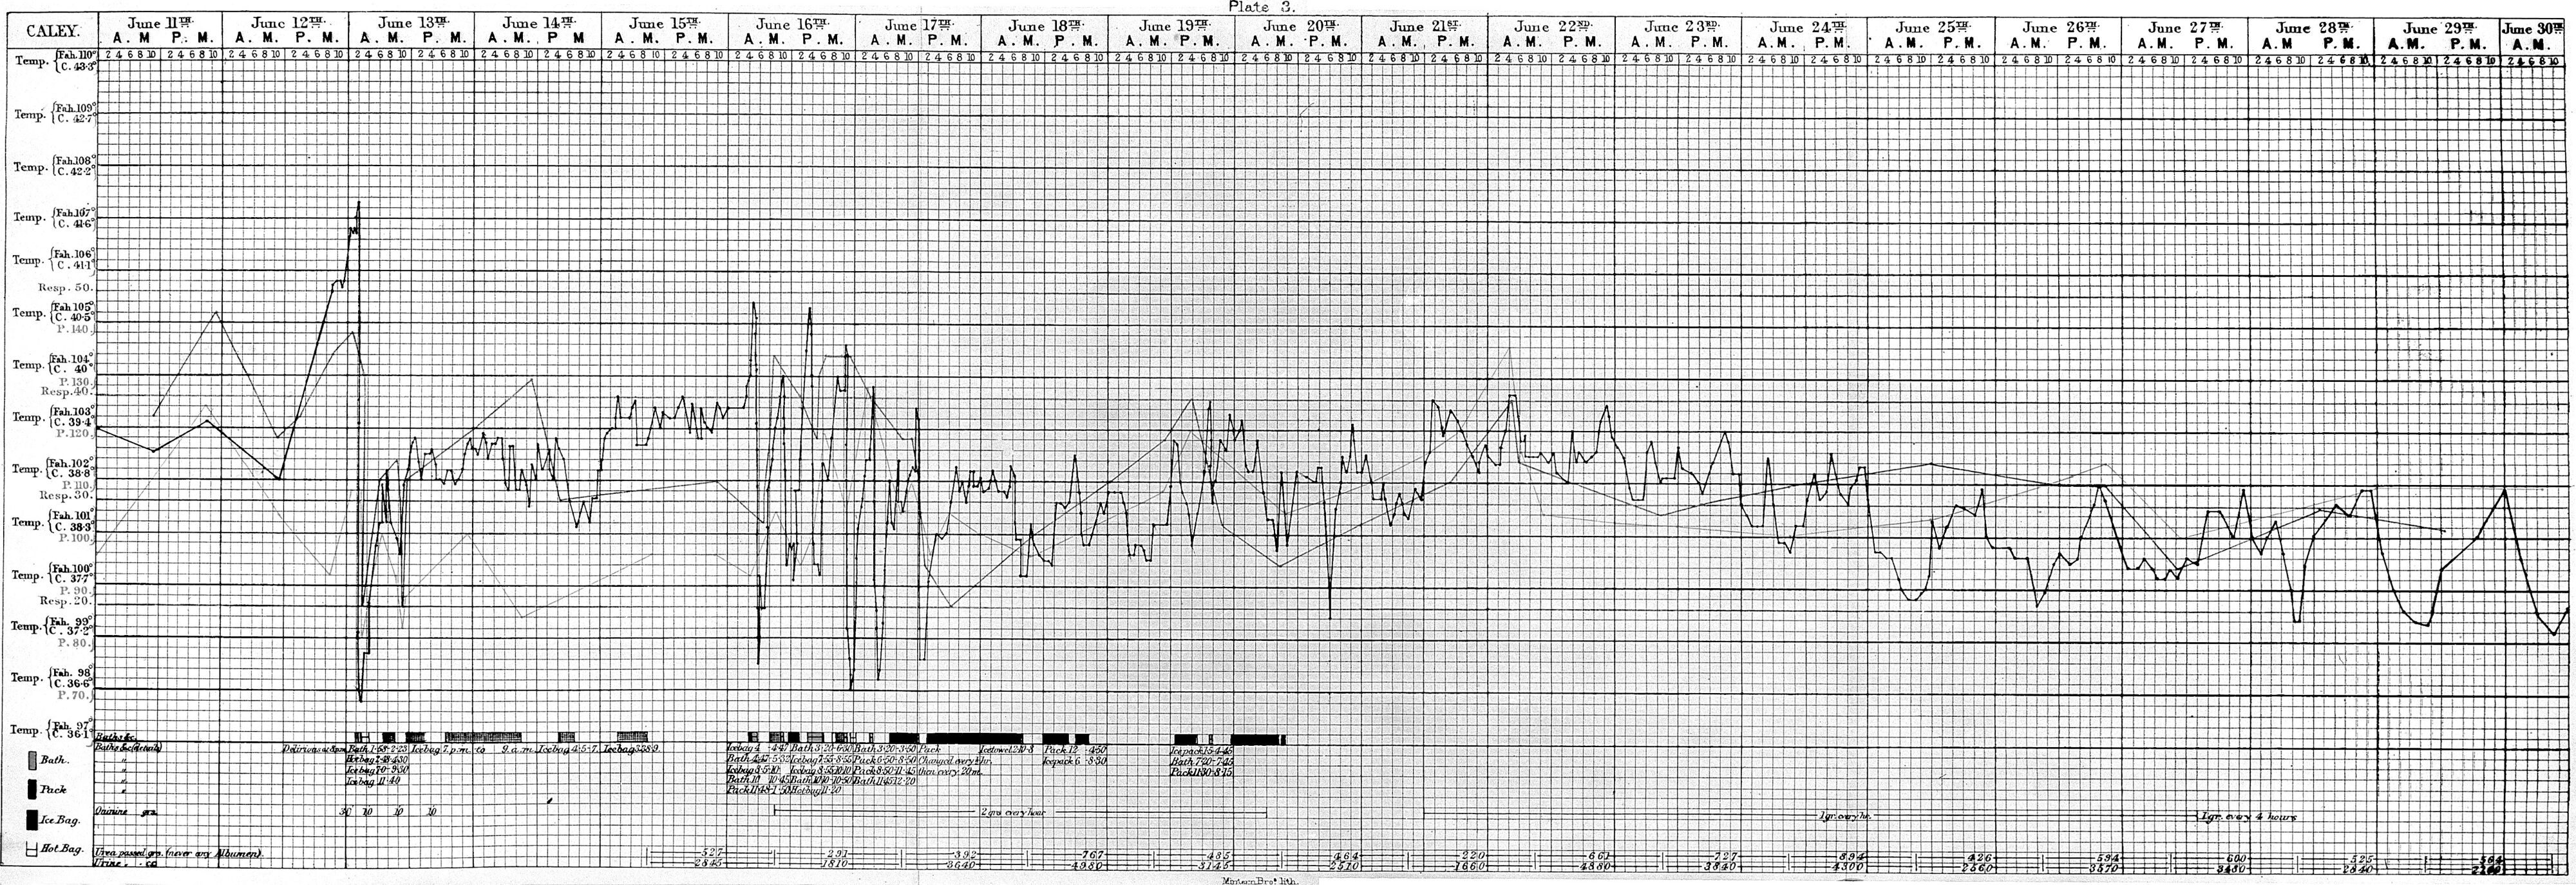
A printed clinical chart from June 1871 with temperature, pulse and respiration traced across twenty days of gridded paper.
Twenty days of one patient with rheumatic fever, 11 to 30 June 1871. Temperature, pulse and respiration share the grid; baths and ice packs are marked underneath. Readings come every few hours when the fever spikes and twice a day when it settles. Labs drawn sporadically, vitals when the ward could: the record was asynchronous from the start. Image: Wellcome Collection, CC BY 4.0.
Digital health

Sensors on a body, a working day in orbit

International Space Station, 20 January 2011
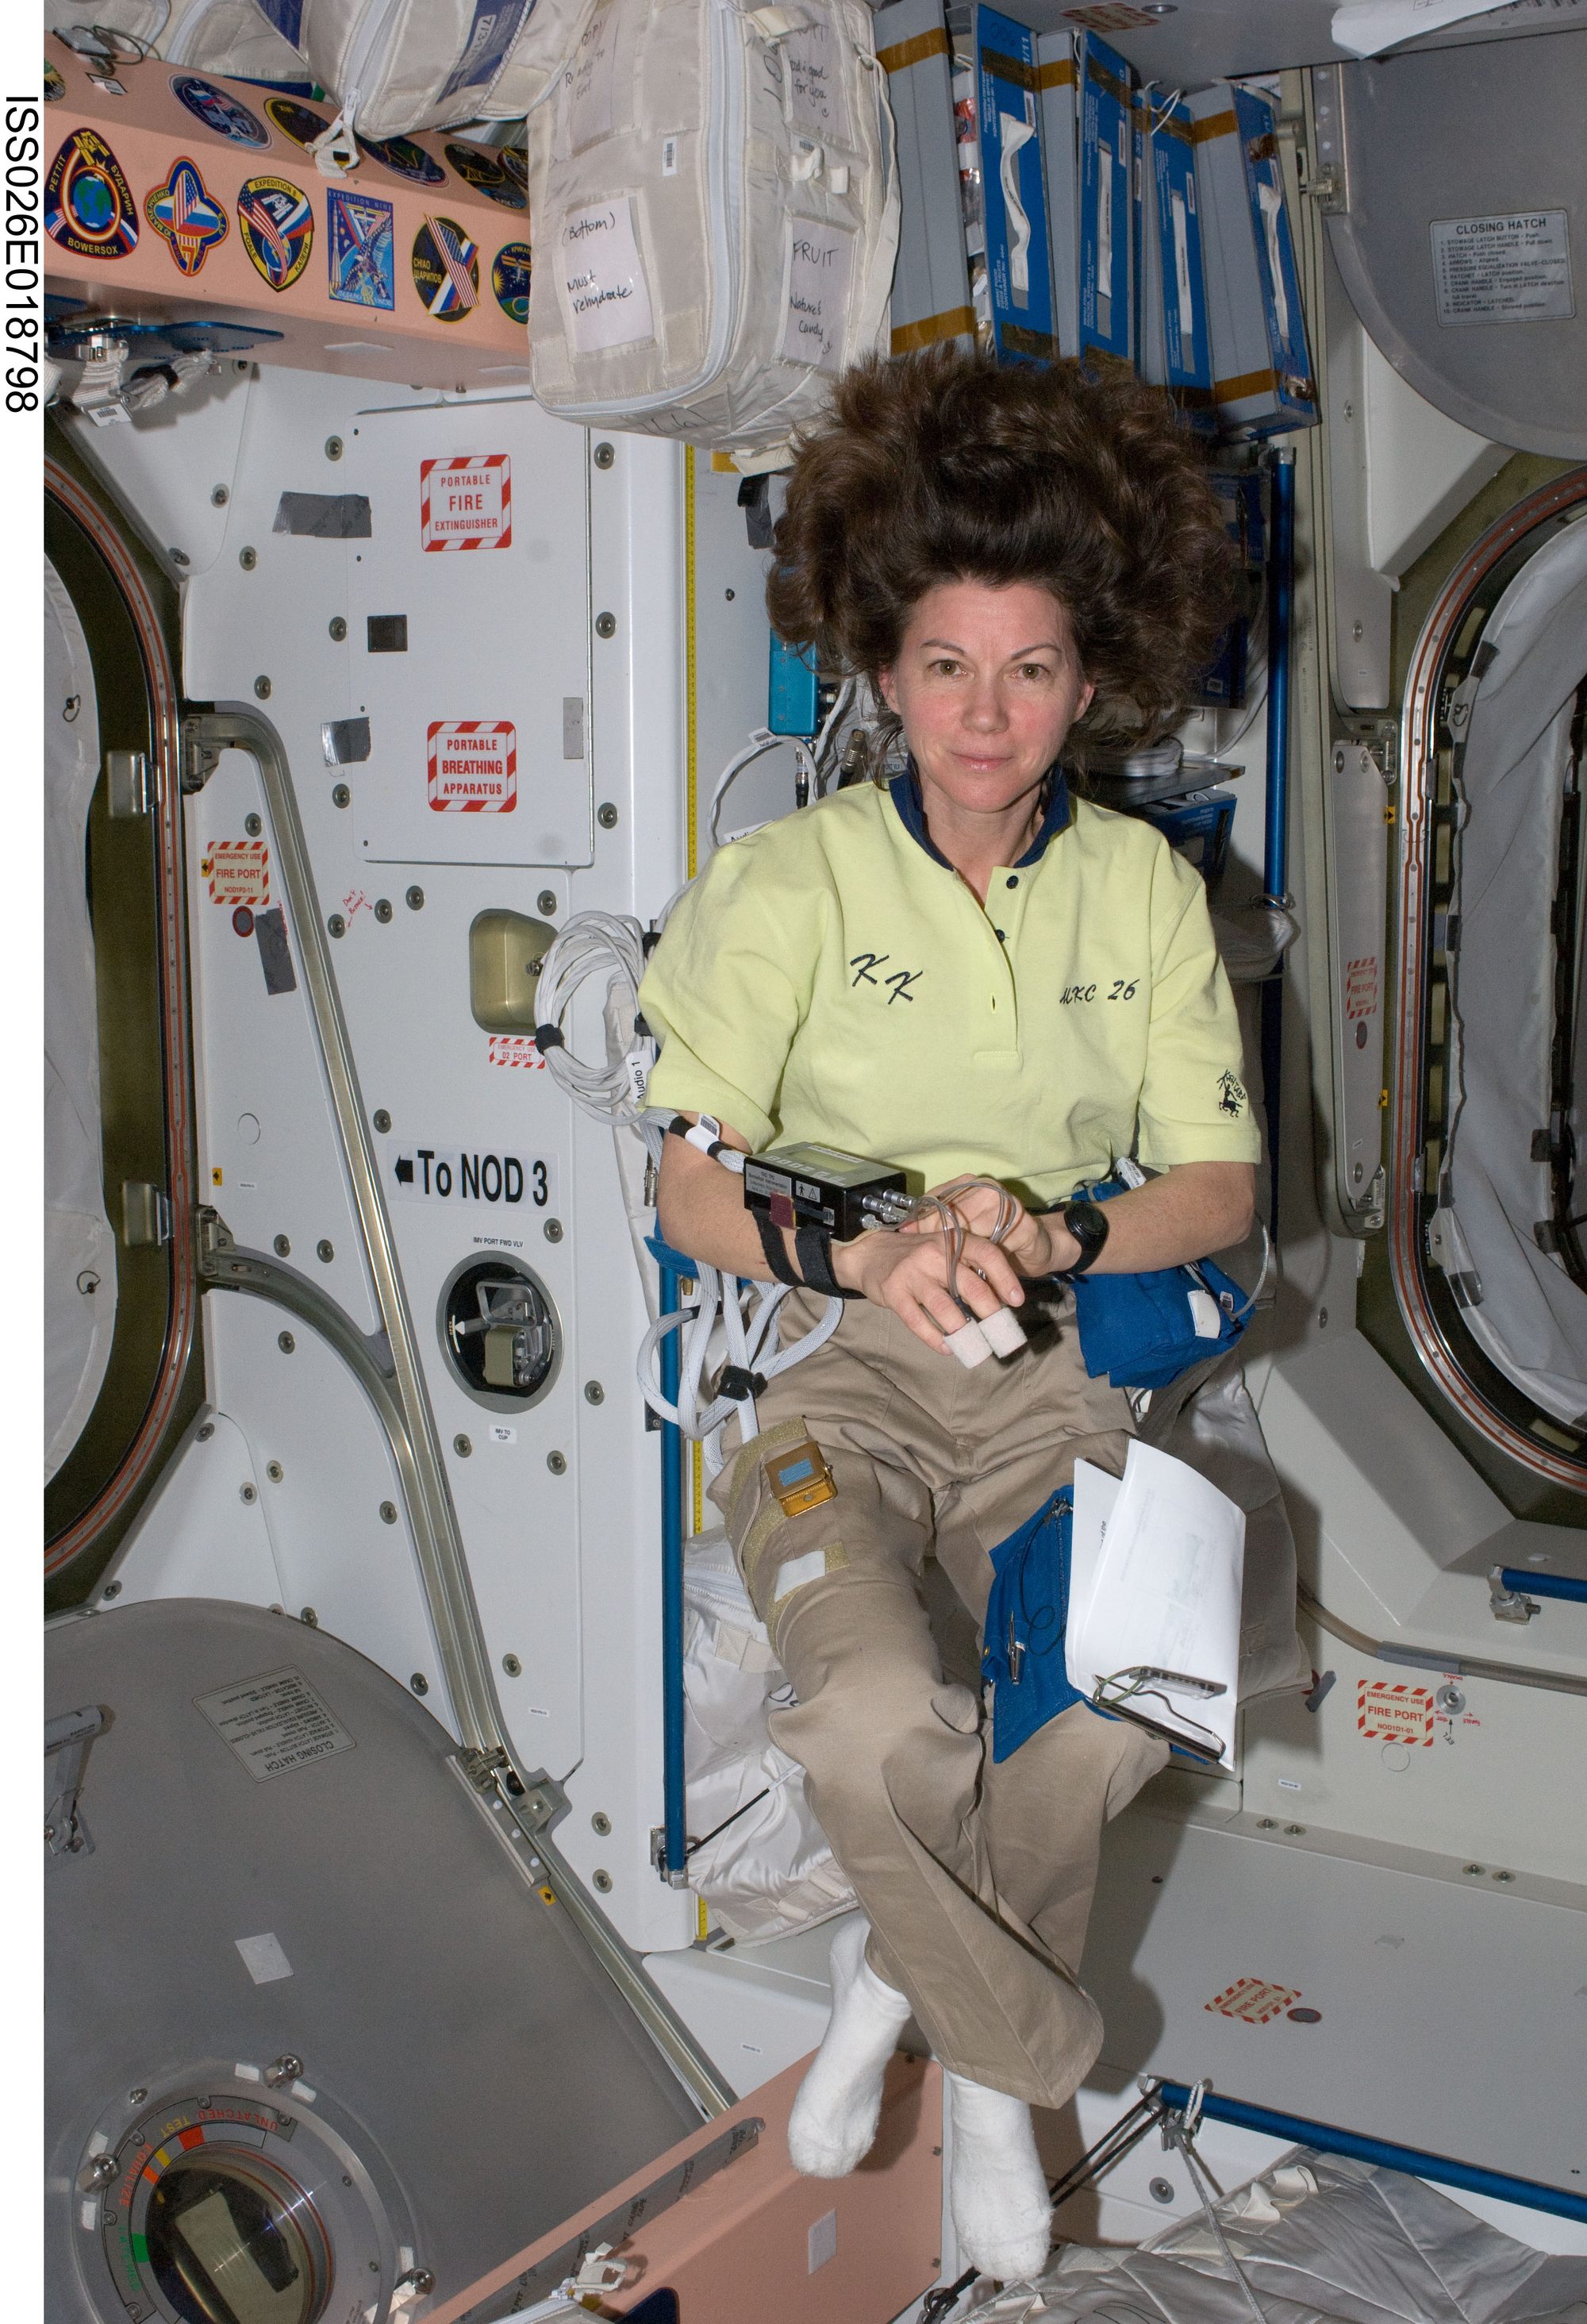
Astronaut Cady Coleman floating in a space station module, wearing chest electrodes, a recorder and a blood-pressure cuff.
NASA astronaut Catherine Coleman, Expedition 26, wearing electrodes, a Holter monitor, a blood-pressure unit and two Actiwatches. The Holter records her electrocardiogram beat by beat, the ESA unit tracks blood pressure continuously on its own cadence, and the Actiwatches at waist and ankle log activity, all through a working day in the Unity node. A body wired to four instruments, each keeping its own time. Image: NASA, ISS026-E-018798. NASA Image and Video Library. Public domain.
Genomics

Each cell seen once, at its own moment

HeLa cells, fluorescence microscopy
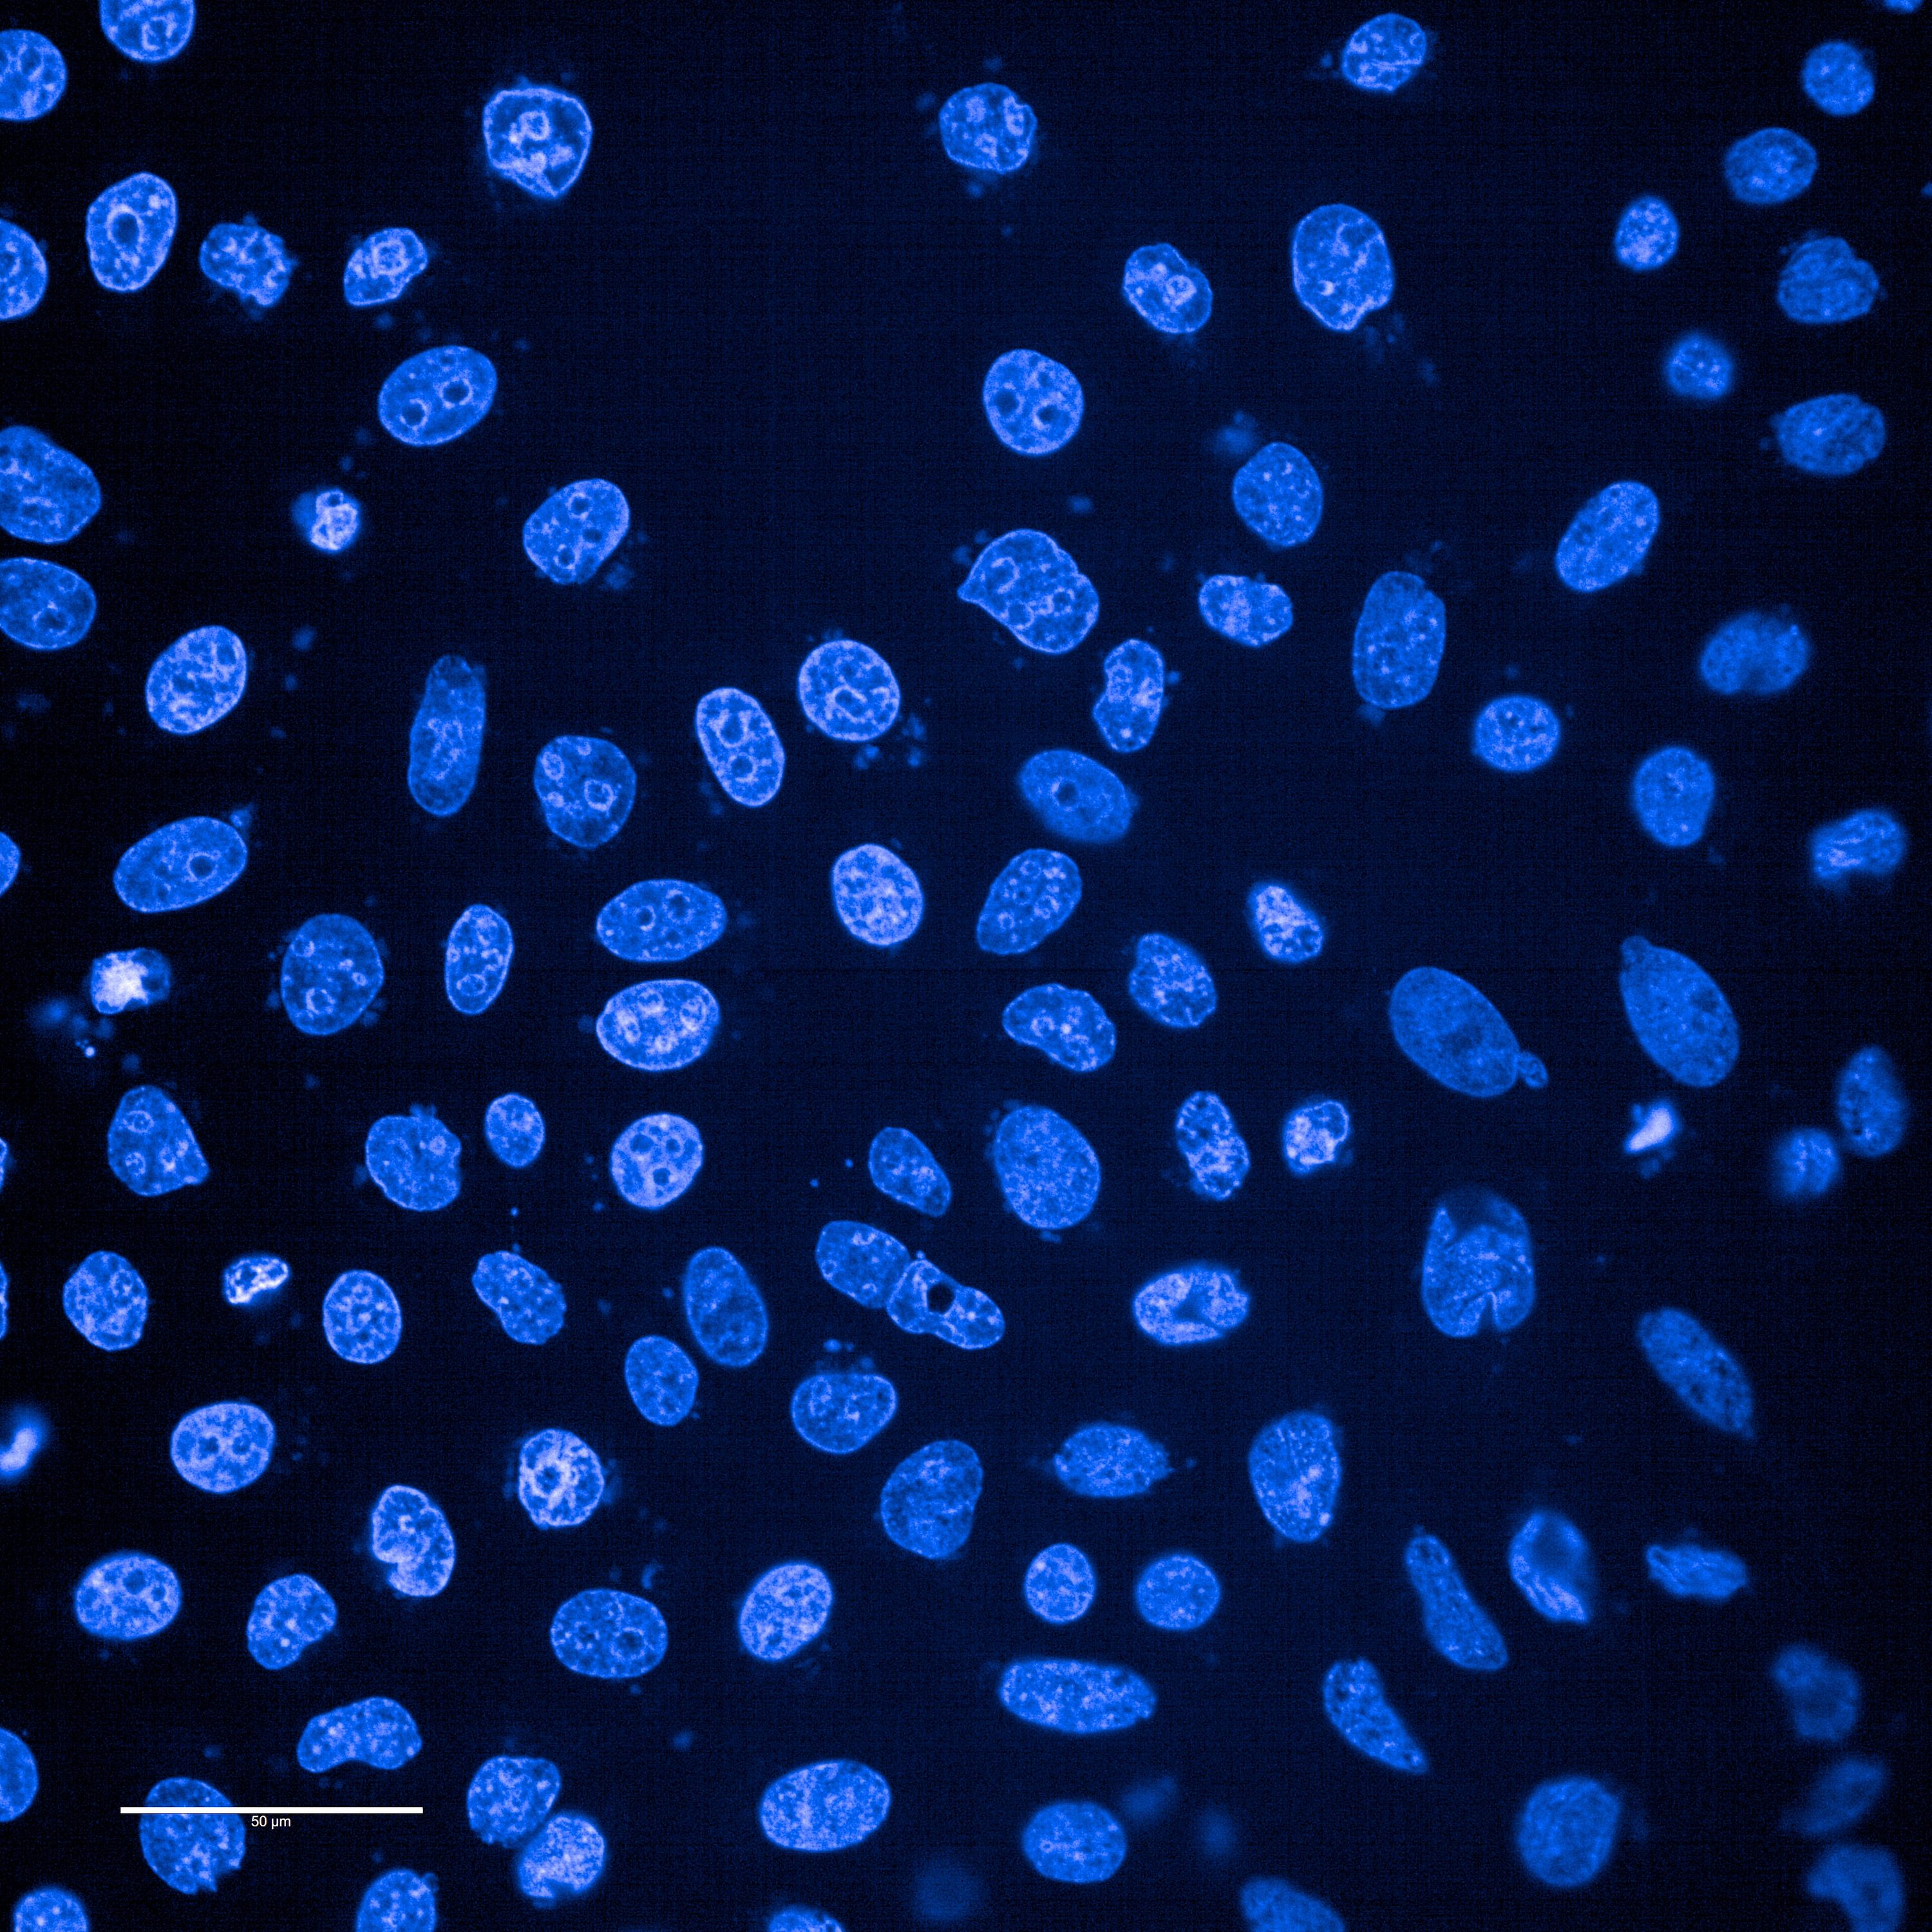
Dozens of blue-stained cell nuclei of different shapes and brightness scattered across a black field.
Nuclei of HeLa cells stained with DAPI. Every nucleus in the field sits at its own point in the cell cycle, and the stain sees each one exactly once. Single-cell measurement is like this throughout: one snapshot per cell, the clock latent, the order reconstructed afterwards from the population. Image: DrBib, via Wikimedia Commons, CC BY 4.0. Downscaled.
Distributed systems

The clock the other clocks drift from

NIST-F4, Boulder, 2025
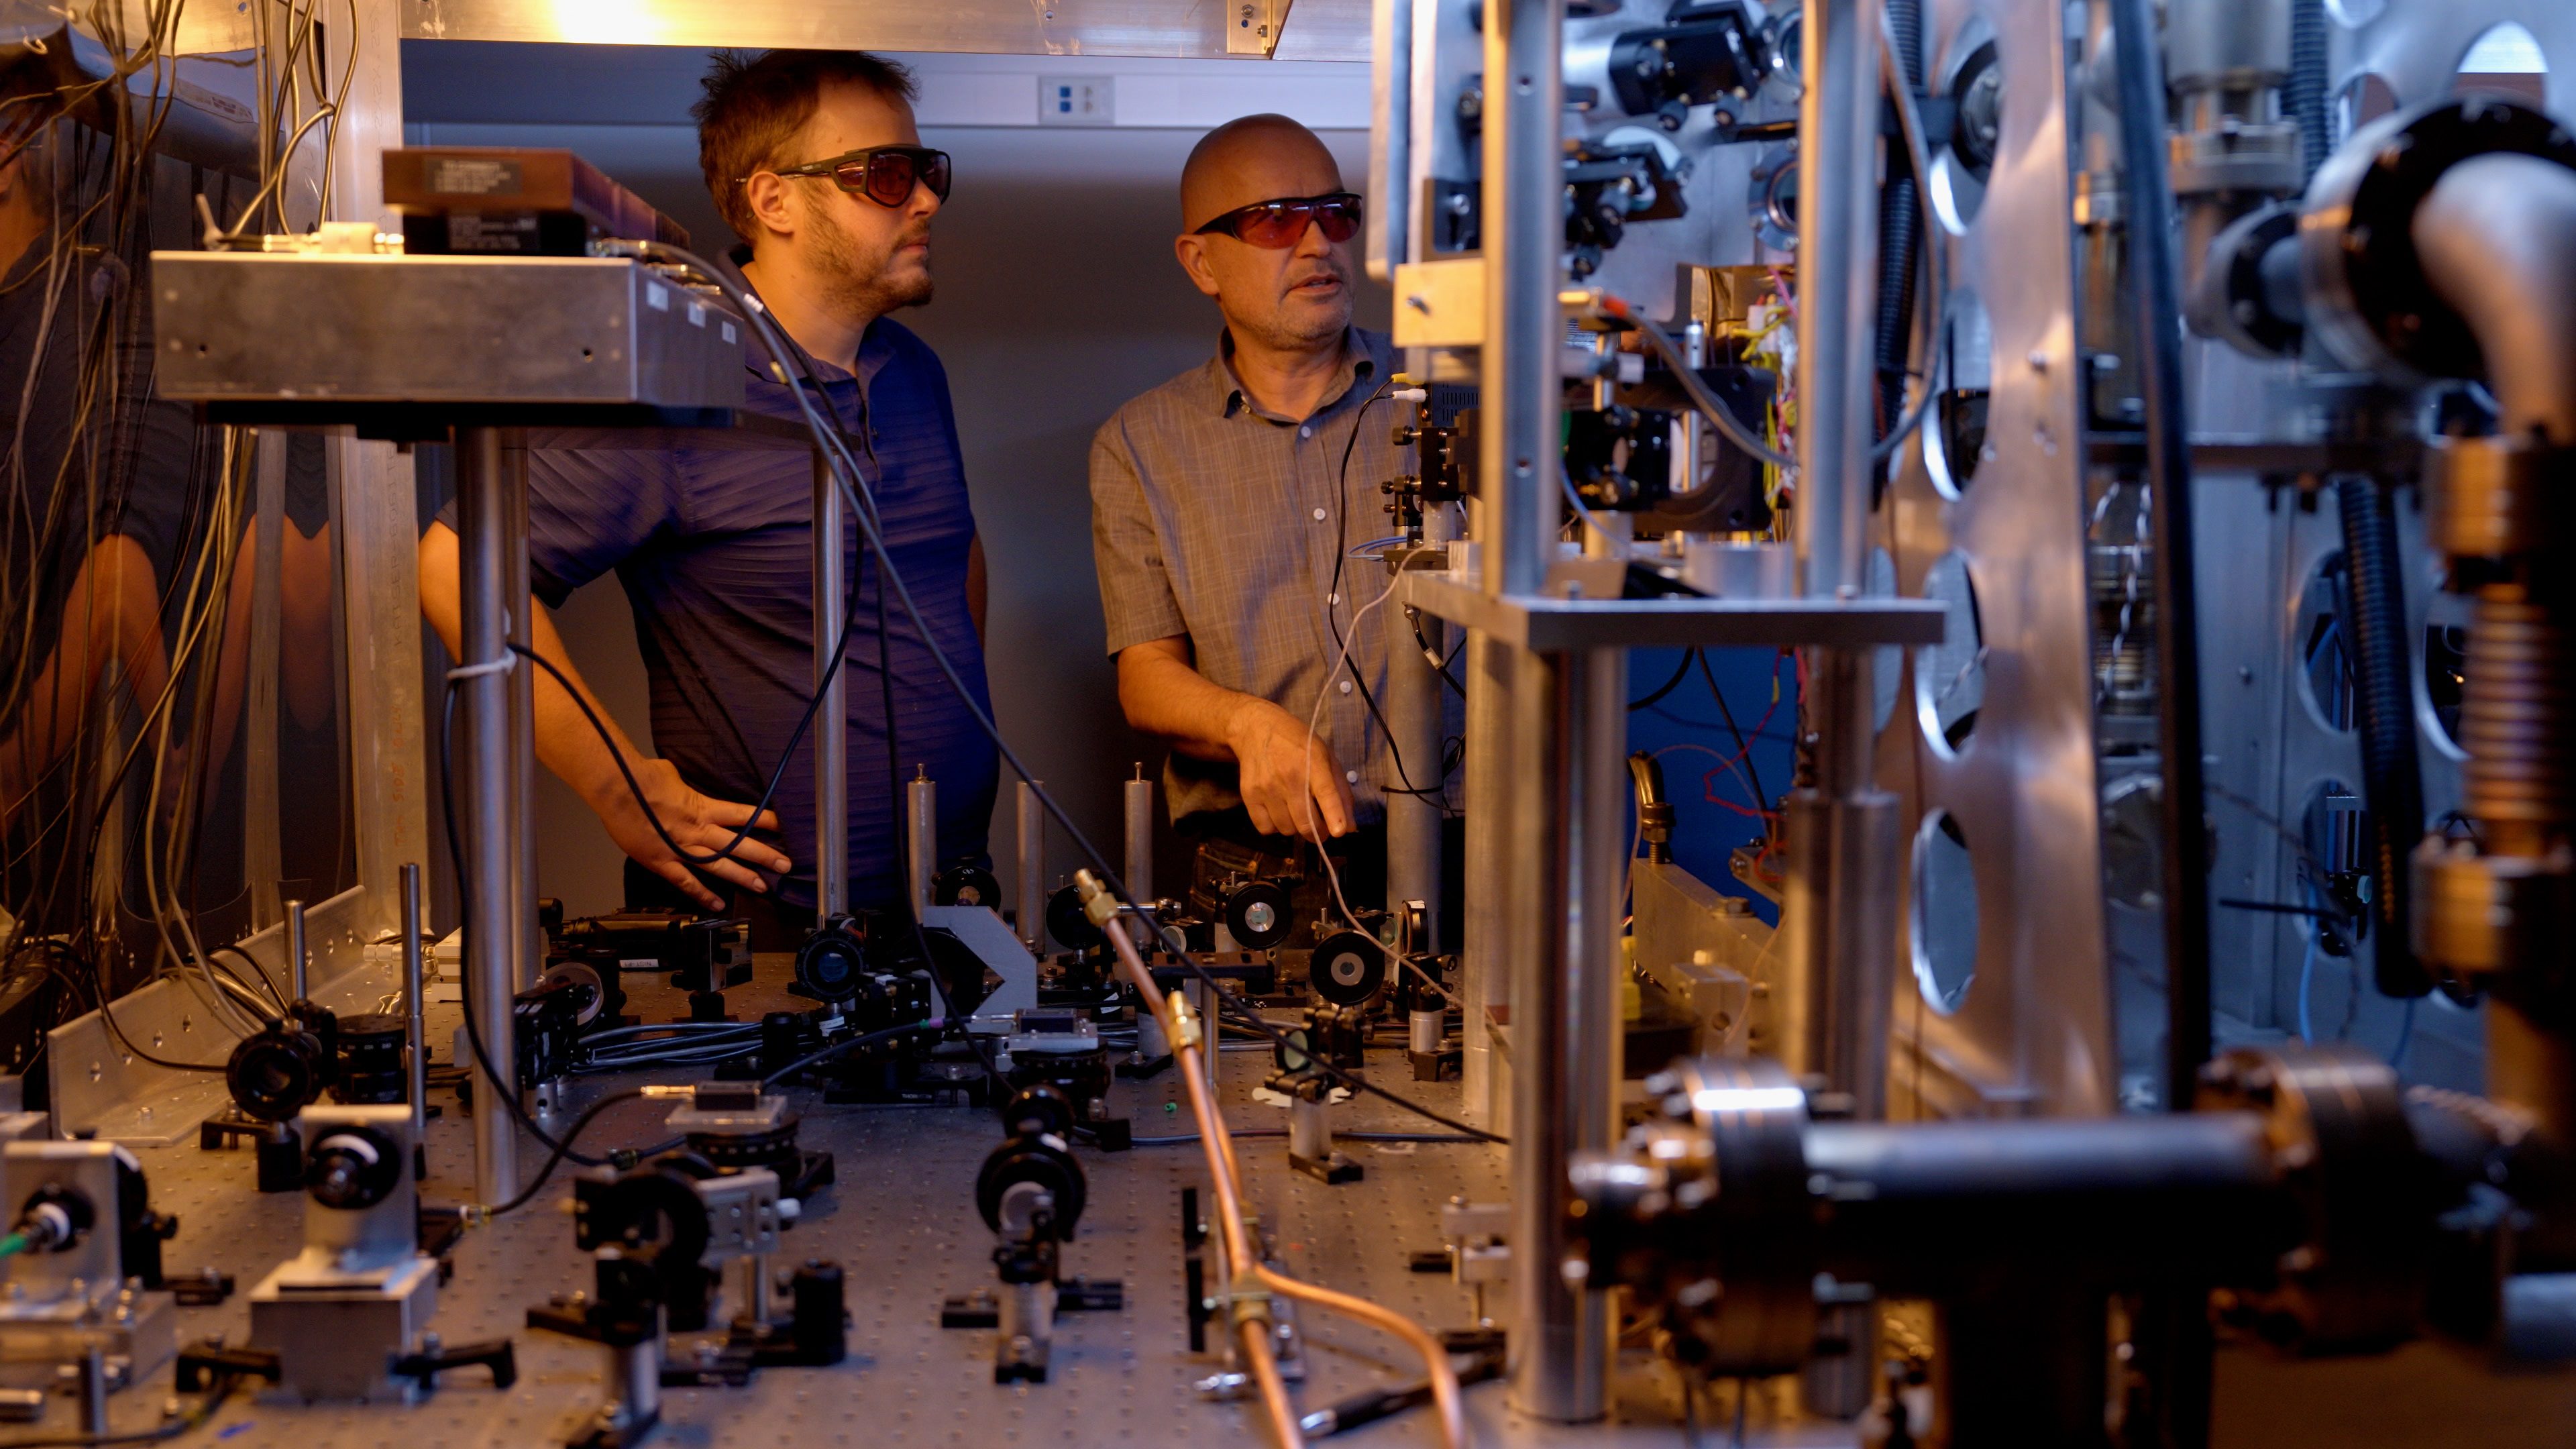
Two physicists in safety glasses at a bench of lasers and optics, part of the NIST-F4 caesium fountain clock.
Greg Hoth and Vladislav Gerginov at NIST-F4, the caesium fountain that became a United States primary frequency standard in 2025. Fewer than twenty such clocks anchor the world's time. Every server, every packet timestamp, every sensor log keeps its own drifting approximation of what this room measures, and no two of them agree. Image: R. Eskalis/NIST. New atomic fountain clock joins elite group that keeps the world on time. Public domain.
Autonomous driving

Twenty-three million returns in eighteen seconds

Folsom and Dore Streets, San Francisco
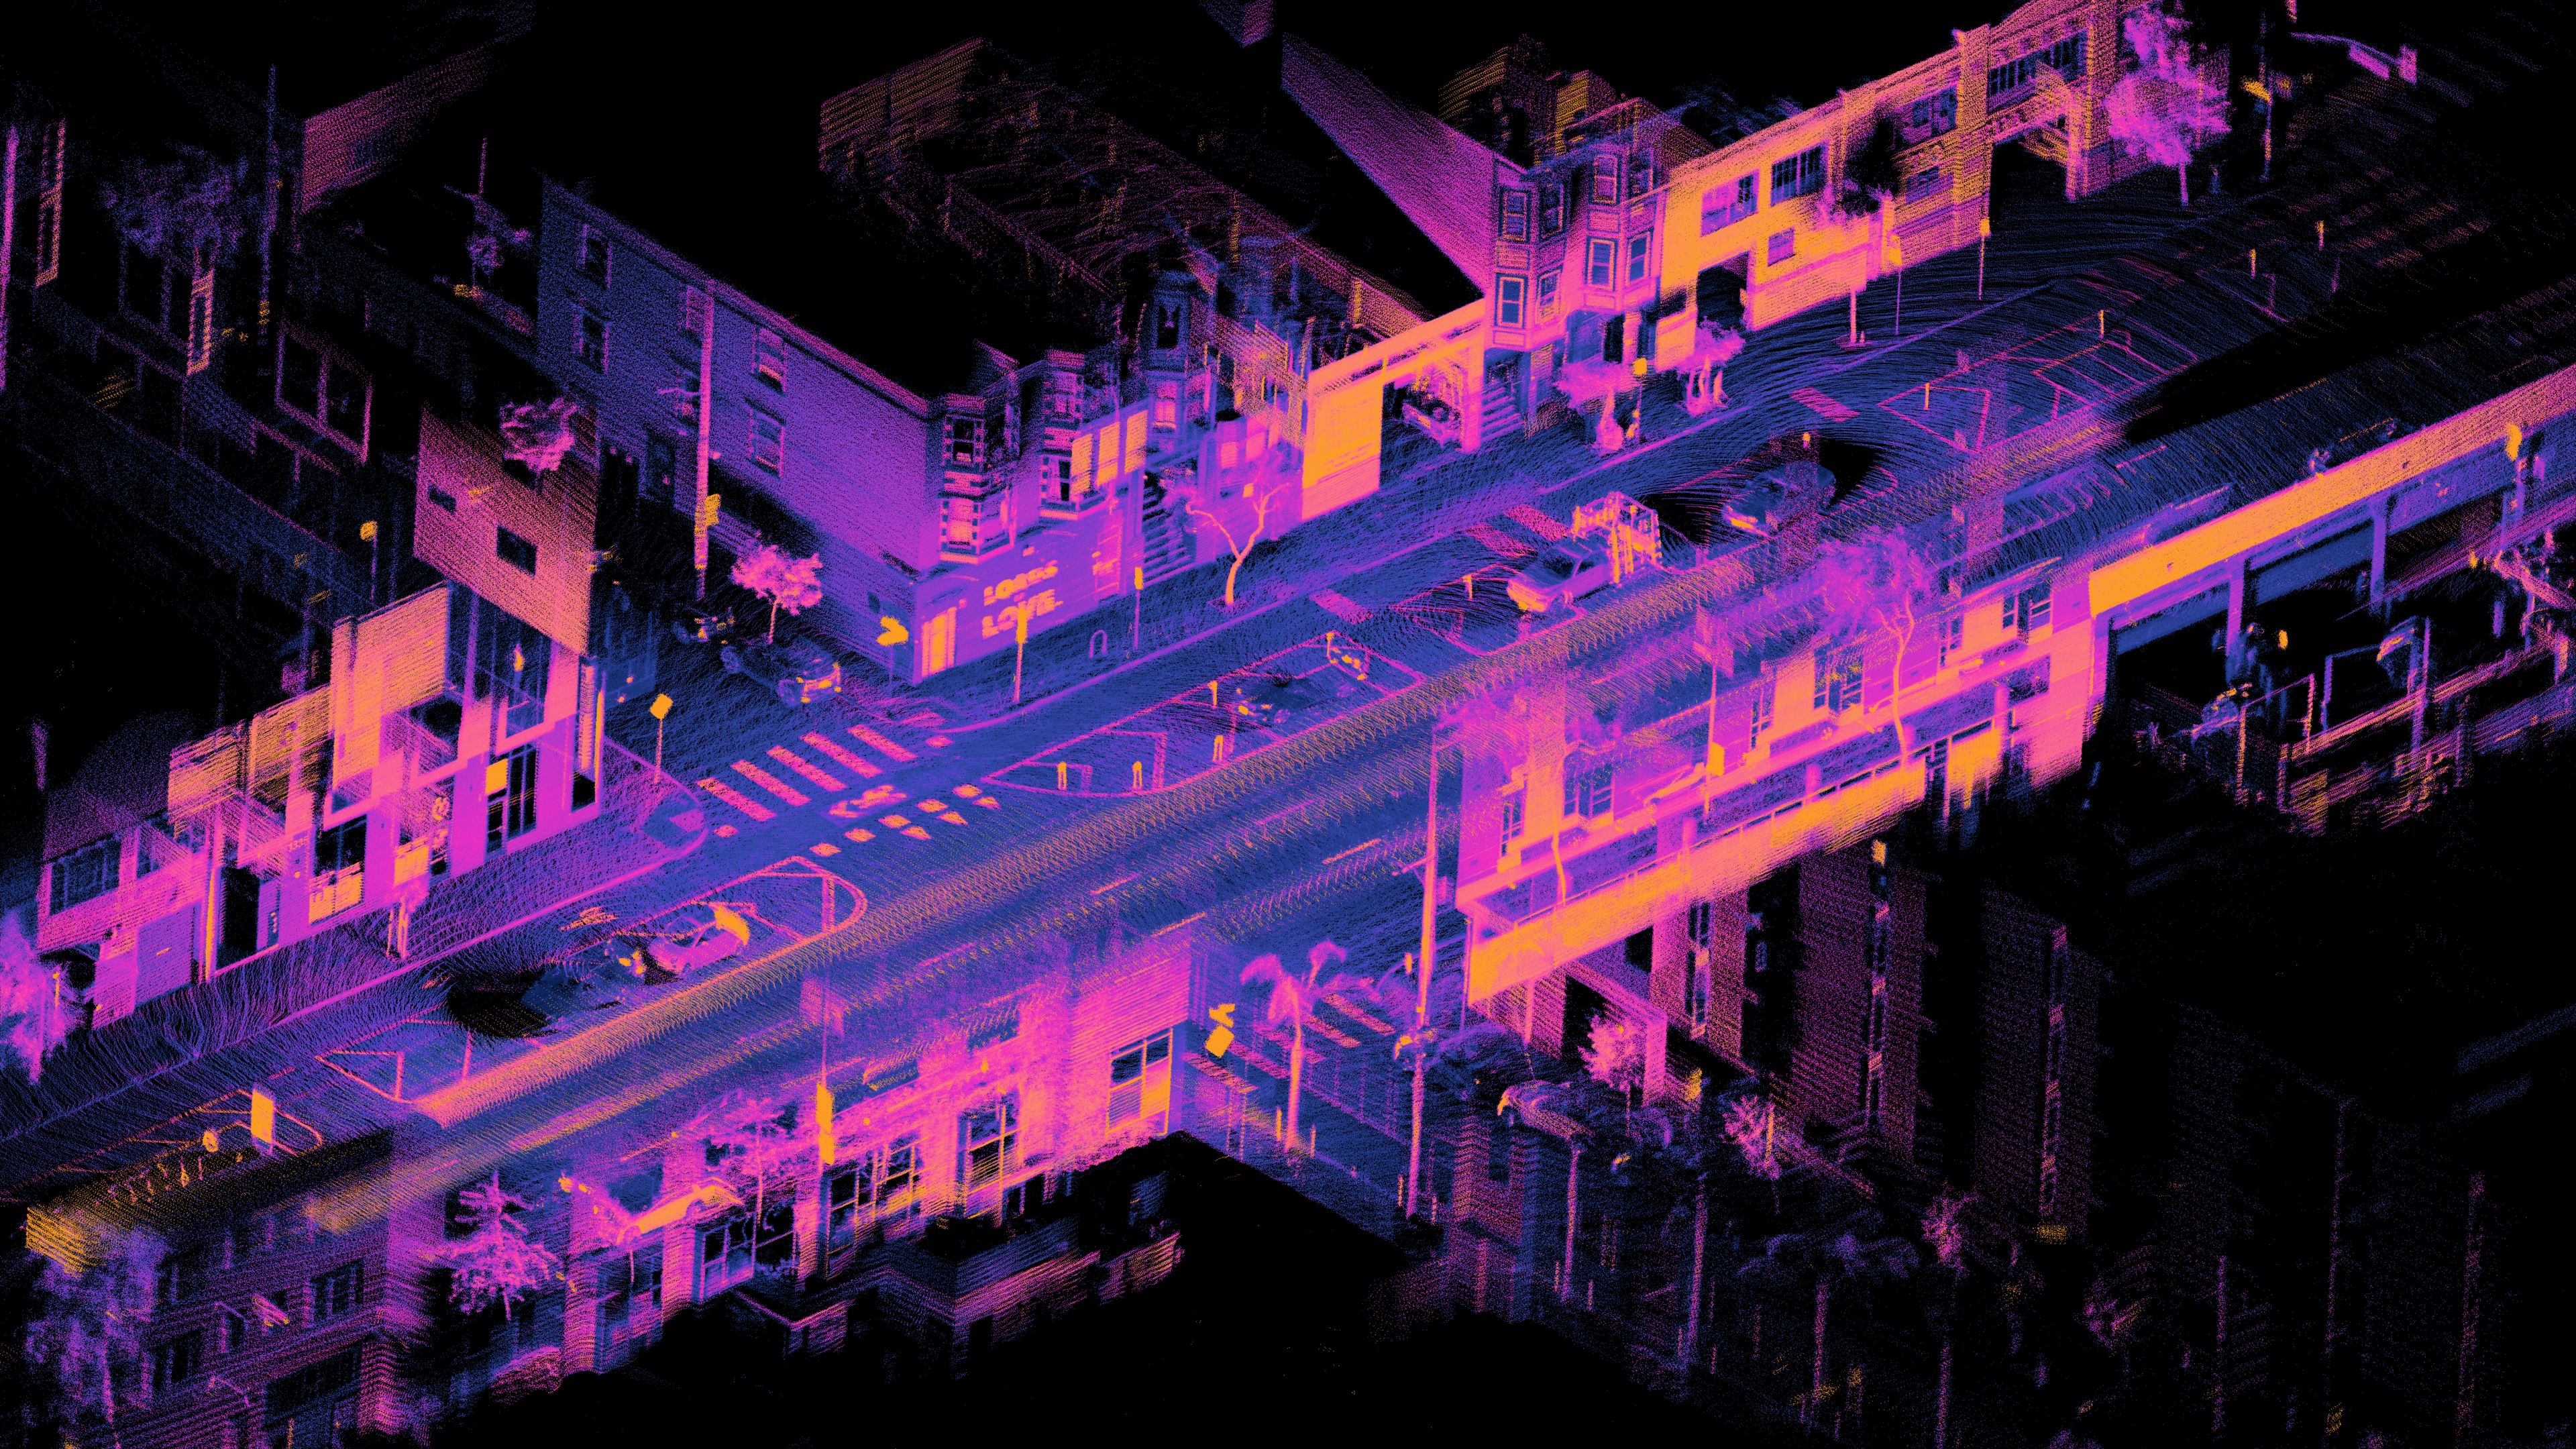
An orthographic lidar point cloud of a city intersection, buildings and trees rendered in orange and violet points on black.
A point cloud from an Ouster OS1 lidar on a moving car, about 23 million returns gathered over 18 seconds. The points were registered in real time while the car's own trajectory was still being estimated from them. Colour is return strength times range. Camera, lidar and radar each sample the road at their own rate; this is what one of them sees alone. Image: Daniel L. Lu, via Wikimedia Commons, CC BY 4.0. Downscaled.
Finance

The asynchronous price feed, before it had a name

New York Stock Exchange, about 1922
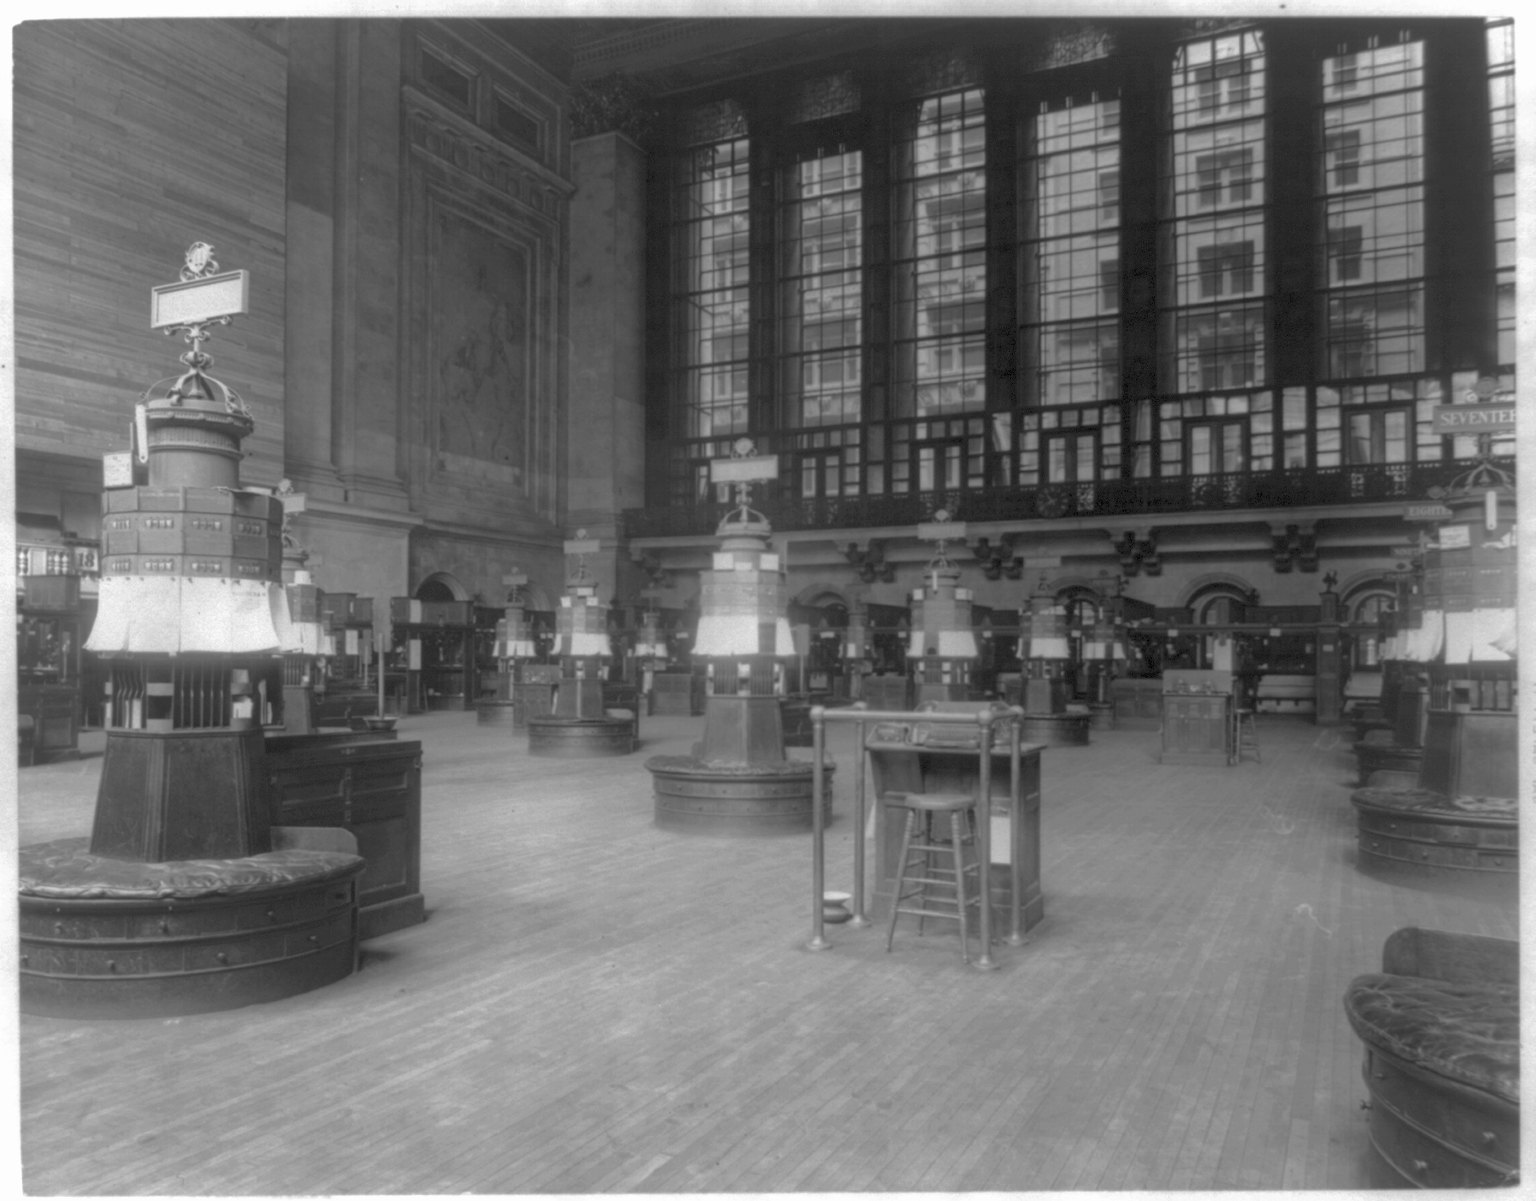
The empty floor of the New York Stock Exchange around 1922, with ornate ticker and quotation stations under tall windows.
Automatic ticker apparatus and quotation kiosks, seen from the floor of the New York Stock Exchange. Each machine printed a trade at whatever moment it arrived, minutes behind the posts, and no two tapes ran on the same clock. The problem we work on was already on this floor; the tools to solve it exactly came a century later. Image: Library of Congress, Prints and Photographs Division, LC-USZ62-41291. Record. No known restrictions on publication.